State Medicaid Dental Fee Index 2026: What Medicaid Pays Dentists, State by State
A porcelain/ceramic crown (D2740) pays from $272.83 in Illinois to $1,512.65 in Delaware, with a median of $552.40 across 34 of 51 jurisdictions with a listed paying adult fee. These fee-for-service program rates are not patient prices.
Delaware · Porcelain/ceramic crown (D2740)
$1,512.65
- Rank (highest fee = 1)
- 1 of 34
- Vs. median ($552.40)
- +173.8%
- Source schedule date
- April 1, 2026
- Schedule type
- General schedule
All jurisdictions: Porcelain/ceramic crown (D2740) · 34 ranked with a paying adult fee
| Rank | State | Fee | Vs. median | Source date | Schedule type |
|---|---|---|---|---|---|
| 1 | $1,512.65 | +173.8% | April 1, 2026 | General schedule | |
| 2 | $1,048.80 | +89.9% | July 7, 2026 | General schedule | |
| 3 | $891.75 | +61.4% | Not available | General schedule | |
| 4 | $838.37 | +51.8% | July 1, 2026 | General schedule | |
| 5 | $826.62 | +49.6% | January 1, 2026 | General schedule | |
| 6 | $817.57 | +48.0% | March 11, 2026 | General schedule | |
| 7 | $816.55 | +47.8% | January 1, 2025 | General schedule | |
| 8 | $790.40 | +43.1% | January 1, 2026 | General schedule | |
| 9 | $766.65 | +38.8% | July 1, 2026 | General schedule | |
| 10 | $745.09 | +34.9% | April 1, 2026 | General schedule | |
| 11 | $729.00 | +32.0% | October 2, 2025 | General schedule | |
| 12 | $703.19 | +27.3% | July 1, 2026 | General schedule | |
| 13 | $689.59 | +24.8% | July 4, 2026 | General schedule | |
| 14 | $669.50 | +21.2% | July 1, 2024 | General schedule | |
| 15 | $622.35 | +12.7% | July 1, 2026 | General schedule | |
| 16 | $571.61 | +3.5% | June 1, 2026 | General schedule | |
| 17 | $554.80 | +0.4% | July 1, 2026 | General schedule | |
| 18 | $550.00 | -0.4% | Not available | General schedule | |
| 19 | $537.60 | -2.7% | October 1, 2025 | General schedule | |
| 20 | $529.95 | -4.1% | January 1, 2026 | General schedule | |
| 21 | $523.25 | -5.3% | October 1, 2026 | General schedule | |
| 22 | $505.00 | -8.6% | January 1, 2026 | General schedule | |
| 23 | $501.12 | -9.3% | Not available | General schedule | |
| 24 | $500.00 | -9.5% | August 1, 2026 | General schedule | |
| 25 | $478.09 | -13.5% | Not available | General schedule | |
| 26 | $473.54 | -14.3% | July 1, 2026 | General schedule | |
| 27 | $469.79 | -15.0% | January 1, 2026 | General schedule | |
| 28 | $459.90 | -16.7% | July 1, 2026 | General schedule | |
| 29 | $421.60 | -23.7% | January 1, 2026 | General schedule | |
| 30 | $393.84 | -28.7% | August 1, 2023 | General schedule | |
| 31 | $340.00 | -38.5% | May 1, 2026 | General schedule | |
| 32 | $324.00 | -41.3% | Not available | General schedule | |
| 33 | $278.30 | -49.6% | January 1, 2026 | General schedule | |
| 34 | $272.83 | -50.6% | July 1, 2026 | General schedule | |
| — | Children's schedule: $616.13 | — | Not available | Children's schedule | |
| — | Children's schedule: $252.25 | — | September 1, 2026 | Children's schedule | |
| — | Children only (ages 0-20): $340.37 — not payable for adults | — | January 1, 2026 | General schedule; child-only for this code | |
| — | Children only (ages 0-20): $543.72 — not payable for adults | — | April 1, 2026 | General schedule; child-only for this code | |
| — | Children only (ages 0-20): $1,242.13 — not payable for adults | — | April 1, 2026 | General schedule; child-only for this code | |
| — | Children only (ages 0-20): $600.00 — not payable for adults | — | January 1, 2026 | General schedule; child-only for this code | |
| — | Children only (ages 0-20): $609.77 — not payable for adults | — | January 1, 2026 | General schedule; child-only for this code | |
| — | Children only (ages 0-20): $560.97 — not payable for adults | — | July 1, 2026 | General schedule; child-only for this code | |
| — | Children only (ages 0-20): $731.25 — not payable for adults | — | July 1, 2026 | General schedule; child-only for this code | |
| — | No practitioner rate (facility/ASC amount only) | — | July 1, 2026 | General schedule | |
| — | Not listed | — | Not available | General schedule | |
| — | Not listed | — | July 1, 2026 | General schedule | |
| — | Not listed | — | December 12, 2024 | General schedule | |
| — | Not listed | — | January 1, 2026 | Children's schedule | |
| — | Not listed | — | Not available | General schedule | |
| — | Not listed | — | April 1, 2026 | General schedule | |
| — | Not listed | — | January 1, 2026 | General schedule |
Embeddable chart: Medicaid crown fees by state
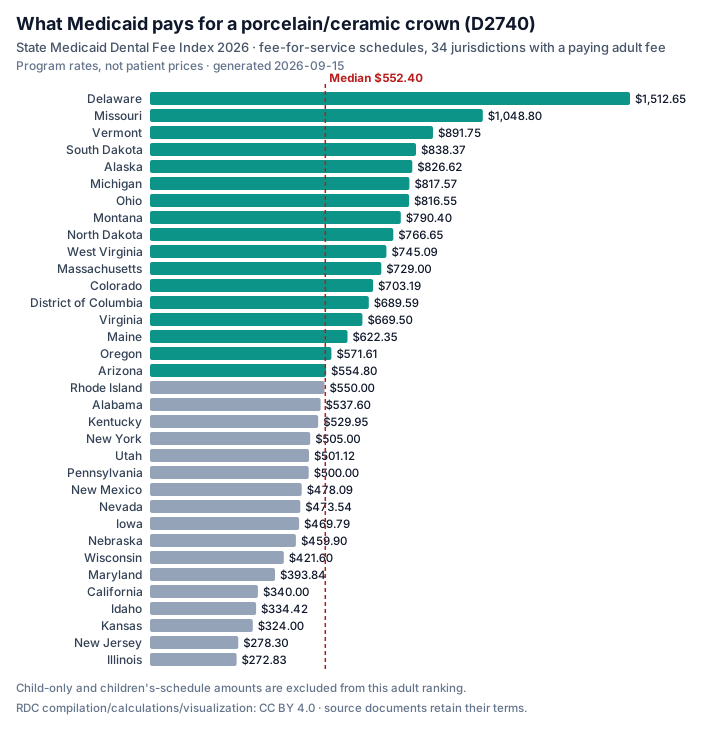
Journalists and researchers can republish the chart or the live widget below with credit.
<iframe src="https://realdentalcosts.com/embed/medicaid-dental-fee-index-2026.html"
  width="100%" height="520" style="border:1px solid #e2e8f0;border-radius:12px;max-width:560px"
  loading="lazy" title="State Medicaid Dental Fee Index 2026"></iframe>
<p style="font-size:13px;margin:6px 0 0">Compilation: <a href="https://realdentalcosts.com/en/medicaid-dental-fee-index-2026/">State Medicaid Dental Fee Index 2026 — Real Dental Costs</a> (RDC compilation and visualization: CC BY 4.0; source rights reserved)</p>
Paste into an article or CMS that accepts HTML. Keep the attribution and source-rights notice below the iframe.
Key findings
- 5.5× spread for a crown. The highest schedule (Delaware, $1,512.65) pays 5.5× the lowest (Illinois, $272.83) for the same porcelain/ceramic crown (D2740).
- Dentures: $311.37 to $2,083.26. A complete upper denture (D5110) is listed from $311.37 in Florida to $2,083.26 in Delaware, median $730.74 across 42 jurisdictions.
- Source dates require context. Of 51 source schedule records, 37 carry a stored 2026 date and 2 a date from the second half of 2025. 8 have no document-level date available (Arkansas, Kansas, Minnesota, New Mexico, Rhode Island, Tennessee, Utah and Vermont); Nebraska (July 1, 2026, inferred from PDF metadata) and Virginia (July 1, 2024, inferred from filename) use inferred dates. Stored dates may be effective, as-of or revision dates, so they are not a uniform measure of when every code last changed.
What Medicaid pays vs what Medicaid paid
A fee schedule is a published rate. HHS/CMS T-MSIS summarizes paid amounts in published claim-line cells. The comparison below is exploratory rather than like-for-like: it compares a state program schedule with claims attributed to the provider's practice state.
| Procedure (CDT) | States shown | Paid above fee | U.S. paid per line, 2024 |
|---|---|---|---|
| Porcelain/ceramic crown (D2740) | 16 | 8 | $544.98 |
| Molar root canal (D3330) | 12 | 4 | $518.40 |
| Complete upper denture (D5110) | 11 | 2 | $487.74 |
| Core buildup (D2950) | 16 | 5 | $115.57 |
For a crown, the largest descriptive differences between schedule fees and paid-per-line figures drawn from different populations and periods:
| State | Schedule fee | Paid per line, 2024 | Paid ÷ fee |
|---|---|---|---|
| Illinois | $272.83 | $450.35 | 1.65 |
| New Jersey | $278.30 | $411.87 | 1.48 |
| California | $340.00 | $474.47 | 1.40 |
| West Virginia | $745.09 | $598.26 | 0.80 |
| Alabama | $537.60 | $340.69 | 0.63 |
| Alaska | $826.62 | $342.77 | 0.41 |
T-MSIS amounts are 2024 preliminary figures covering fee-for-service, managed care and CHIP claims for all ages. State is assigned from the servicing provider's NPPES practice address (billing provider when servicing is unavailable), not necessarily the beneficiary or payer-program state. HHS suppresses provider × code × month cells with fewer than 12 claim lines or 12 patients, so these are weighted averages of published cells, not complete-claims averages. States flagged for unreliable encounter amounts are excluded (Arizona, Florida, Michigan, Oregon and Virginia), as are state-code cells with fewer than 10 dentists represented in published cells. Children's schedules (Louisiana, Tennessee and Texas) are left out. Source: HHS/CMS Medicaid Provider Spending by HCPCS (T-MSIS), version 2026-02-09 (federal government work; attribution by courtesy).
Two source checks
Arizona. The AHCCCS capped fee schedule workbook effective October 1, 2026 adds 8 dental codes that were previously paid By Report, a change announced in a state notice dated August 17, 2026. A first version of the workbook disagreed with the notice on 3 codes; AHCCCS republished it on September 24, 2026 with the notice amounts, and that version is the one used here. Against the secondary ADA-compiled index, 0 of 334 codes compared differ. The index uses the workbook amounts.
Wisconsin. ForwardHealth's primary maximum fee extract was compared with the ADA-compiled index as of September 1, 2025: 88 codes differ and 73 match, with a largest difference of $168.94. 126 codes appear only in the primary extract, including the crown code D2740. The index uses the ForwardHealth extract.
Methodology and limits
- Program rates, not prices. Every published amount is a fee-for-service rate from a state Medicaid dental schedule document. It is not what a patient pays, and it is not what managed care dental plans necessarily pay their dentists.
- Texas. Texas Health Steps schedule (ages 0-20); Texas Medicaid has no comprehensive adult dental benefit.
- Children's schedules. The schedules used for Louisiana and Tennessee are children's schedules; the tool labels every row's scope.
- Virginia. Effective date inferred from the source file name (07/01/2024); the document prints none.
- New Hampshire. Manual-pricing flag with no printed amount.
- Adult rate, children's rate, not listed. Each ranked amount is the adult (21+) general-dentist rate in force. A code priced only for ages 0-20 is shown separately as children only, with the children's amount (for 7 jurisdictions on the crown code); a code from a children's schedule is shown with its amount and labeled. A code printed at $0.00 is shown as listed at $0, without inferring coverage or payment behavior, a code for which the schedule prints only an ambulatory surgical center (facility) amount as facility rate only (Idaho: The Idaho numerical fee schedule (July-September 2026) prints N/A in the practitioner Price/Allowed Amount columns for dental codes and publishes only ambulatory surgical center (ASC) amounts.), and a code absent from the schedule as not listed (Indiana: Marked not covered (NOCOV) in the schedule.). None of these non-adult statuses is ranked or counted in the median.
- Dates. “Source schedule date” may be an effective, as-of or revision date. Nebraska and Virginia use clearly labeled inferred dates; a separate per-code rate-effective date is shown when the source provides one. Do not interpret the source date as the last change date for every code.
- Ranks and medians are computed over general schedules with a paying adult fee for each code. See our methodology; report an error through data corrections.
- Reuse. CC BY 4.0 applies to the Real Dental Costs compilation, original labels, calculations and visualization. Underlying source documents remain subject to their source terms. Managed-care payer rates are excluded from this state fee-for-service index.
- Texas scope. Texas amounts come from the state's published Texas Health Steps schedule (children 0-20); Texas Medicaid has no comprehensive adult dental benefit, so its rows are labeled and not ranked with the adult schedules. Managed-care payer rates are excluded by design.
Press and citation
Key figures, each sourced from the state schedule documents compiled in this index:
- A Medicaid crown (D2740) pays $272.83 in Illinois and $1,512.65 in Delaware; median $552.40.
- The highest state schedule pays 5.5× the lowest for the same crown.
- A Medicaid molar root canal (D3330) ranges from $247.50 in New Jersey to $1,173.04 in Delaware; median $553.28 across 35 jurisdictions with a paying adult fee.
Real Dental Costs Data & Research Team. (2026). State Medicaid Dental Fee Index 2026 [Data set]. Real Dental Costs. https://realdentalcosts.com/en/medicaid-dental-fee-index-2026/ (data generated October 1, 2026).
Download the full table as CSV (one row per state and code, with source URLs). CC BY 4.0 applies to the Real Dental Costs compilation, original labels, calculations and visualization; underlying source documents retain their own terms. Credit “State Medicaid Dental Fee Index 2026, Real Dental Costs” with a link to this page. Media and research questions: research@realdentalcosts.com.
Frequently asked questions
How much does Medicaid pay dentists for a crown?
Which state Medicaid program pays the most for dental work?
Are these the rates a dentist actually receives?
Why do Medicaid dental fees vary so much by state?
Does a listed fee mean Medicaid covers the procedure for adults?
Independent dental pricing research — every series carries a named source, and corrections are logged publicly. Not medical advice.
Disclaimer. This page is pricing and market research, NOT medical advice and not benefits advice. Confirm coverage and rates with your state Medicaid program or dental plan.